Medical statistics
Author: Mila Girardet
The statistician and medical reformer Florence Nightingale agreed, in 1859, to write a popular book revealing Nightingale’s findings to the public. It included the now-famous diagram of soldier fatalities as a fold-out page at the front of the book.
So the message imparted in “England And Her Soldiers” was no less hard-hitting. In her preface, Martineau (a British journalist, writer, sociologist and feminist activist) wrote, ‘we sustained a fearful misfortune in the last war', describing the 'mismanagement, helplessness, and doomed condition' of soldiers there. The book was, she said, 'a grave work and, following its publication in 1859, it was deemed unsuitable for distribution to the libraries at army barracks.
Nevertheless it was widely read outside the army rank-and-file and undoubtedly advanced Nightingale's cause, demonstrating her acute appreciation of the power of publicity through statistics. The two reformers worked together for many years on other projects. In 1925, almost 70 years after the first publication of Nightingale's mortality diagrams, the Austrian polymath Otto Neurath invented the 'Vienna Method of Pictorial Statistics, later known as 'Isotype. He was soon joined by the German mathematician Marie Reidemeister, and together they developed and promoted a graphical method for presenting statistics and processes. The Isotype approach can still be seen in many of today's infographics (a word coined in the 1970s).

Furthermore, the statistician and populariser of mathematics David Spiegelhalter has considered the impact of Nightingale's diagrams, as well as the sotype method, on today's policy landscape. He notes that 'the attractive ambiguity of language becomes a failing when we wish to convey precise information' as words are 'inconsistently interpreted: Numerical data solve this problem, but 'target audiences may have low numeracy.
Instead, A suitably chosen graphic can summarise data concisely' although he notes that this approach brings its own challenges.
 |
 |
|
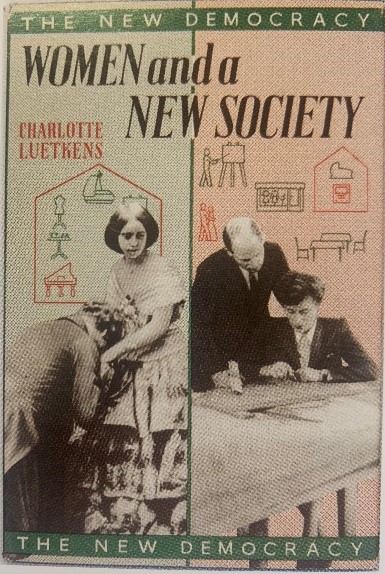
| This chart, from a predecessor of the Isotype Institute, forcefully depicts the relationship between infant death rate and levels of household income. Coffin symbols were used to represent infant deaths. | Women and a New Society, by Charlotte Luetkins, 1946 This is one of a series of books looking at 'the new democracy of social reconstruction and the welfare state in 1940s Britain. It included Isotype charts such as one comparing adult literacy in women and men over the period from 1841 to 1931. |
Moreover, Florence Nightingale's achievements went far beyond her work in nursing. Her approach to statistics and the use of evidence in decision-making has become a cornerstone of modern medicine, as well as enlightening generations of policy-makers through the power of graphic information in communicating complex ideas. This places a duty on all of us. We should strive to become literate in statistics. If policy-makers use infographics when they talk to us, we should be equipped to understand what they are saying - and, at times, to challenge them. As Neurath said in 1945, 'For a democratic society it is important to have a common knowledge in a common language
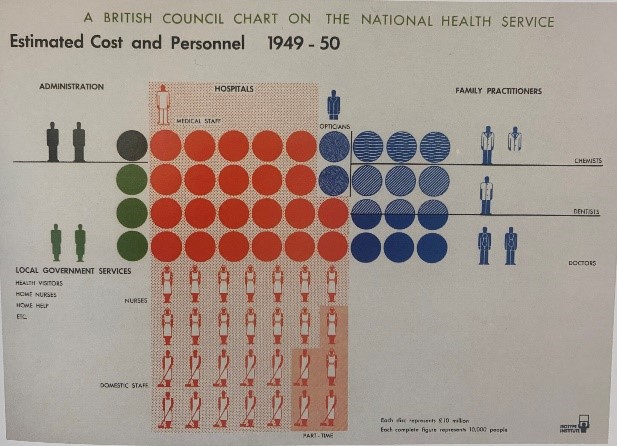 |
Estimated Cost and Personnel 1949-50, by the Isotype Institute, 1950 After the Second World War, the British Council assembled a series of 'study boxes' for overseas students and workers on British practice in areas such as health and welfare. The Isotype Institute prepared charts for the study box on the National Health Service. |